Download free, editable report templates for Word, Excel, and PDF. Choose from business reports, project reports, school reports, and daily progress reports. Perfect for professionals and students.
I have spent a lot of time staring at messy data over the years, and if there is one thing I know for sure, it’s that a good layout can save a bad day. Whether you are putting together a complex business report, wrapping up a major project report, or just trying to finish an academic report before a deadline, a proper template keeps your data where it belongs. It just makes the whole thing look clean and professional.
I have built these free report templates in formats people actually use like Word, Excel, or Google Docs, so you can easily edit them to fit your specific needs or corporate brand.
The Benefit of a Reliable Report Format
Using a standardized report format is a massive time-saver. That said, it is about more than just speed. It ensures that every document your team puts out looks uniform and sharp, which honestly makes a real difference when it lands on a manager’s or client’s desk. Whether you are breaking down a monthly financial statement or a quick sales analysis, having a solid framework means you can focus on the actual numbers instead of fighting with margins and font sizes.
You really don’t have to reinvent the wheel every single time you need to present your work. I put this collection together so you don’t have to start from scratch. Feel free to browse through the examples below, grab the layout that works best for your project, and fill in your data. Hopefully, this saves you some time and a few headaches today.
Why You Should Start Using Report Templates?
A good template does more than just save you a bit of visual layout work. It is an incredibly practical tool for cutting down the hours you spend typing up data, whether you are a corporate manager, a small business owner, or a student trying to organize a massive research project. It keeps your monthly sales reviews, project progress logs, and academic papers organized so people can actually read and understand them.
Saving Time and Staying Consistent
One of the biggest perks here is that you don’t have to start from a blank page every single week. That is a massive relief. A reliable template already has the labels, grids, and font hierarchies locked into place, which ensures your regular weekly or monthly updates always look perfectly neat and tidy without any extra effort on your part.
Looking Professional (Without the Effort)
Let let me be straightforward about this, a messy report makes your hard work look sloppy. Based on my experience designing these over the years, a clean layout turns raw data into something that actually looks polished and easy on the eyes. The Word and Google Docs layouts I have built are fully customizable, so you can tweak the colors or adjust the typography to match your style.
Easy to Adapt for Just About Anything
What I personally like about these layouts is how flexible they really are. You can take a basic structural layout and twist it into anything from a formal performance appraisal to a quick project recap. It takes the pressure off the design side of things. Instead of worrying about whether your margins are lined up properly, you can direct all your energy toward getting your actual information across.
Download Free Editable Flyer Designs
Here is our collection of Free Flyer Templates & Designs to assist your website visitors.




How to Customize These Layouts Without the Fuss
Tinkering with a template shouldn’t feel like a chore. The whole point of using a pre-made framework is to take the design heavy lifting off your plate so you can focus entirely on the actual substance of your business, project, or academic work. Most of what I share here comes in standard, easy-to-edit formats like Word, Excel, and Google Docs, meaning you don’t need any special software to make them your own.
Swapping Out Text and Tweaking Structure
The first thing you want to do is strip out my placeholder text and start dropping in your own copy. Go ahead and change the headings, add new subsections, or remove entire blocks if they don’t fit your project goals. In all my time putting these together, one thing that keeps coming up is that the best reports use short, punchy language. Keep it simple so your reader can grab the main point without wading through extra fluff.
Adding Charts and Tables
If you have data, show it. Dropping in a quick graph, a clean table, or a simple chart makes a massive difference in how people digest your numbers. I have already included neat visual placeholders in many of these layouts, well, most of them anyway, where data tracking makes sense, so you can slip your visuals right into place without throwing the rest of the page alignment out of whack.
Matching Your Personal or Company Brand
This is where you make it look uniquely yours. You can easily swap out my default color schemes, change the font styles, or upload your own company logo right at the top of the page. This might sound obvious but it actually makes a real difference in how credible your document looks to an outside client or stakeholder.
Once you have those three steps down, you can turn a generic layout into a polished, print-ready document in a matter of minutes. Hopefully, this saves you some valuable time today.

Here is the final breakdown of the different report types, written in your exact style, conversational, experienced, and focused on what actually works on standard paper.
The Most Common Types of Reports You’ll Need
Not all reports are built the same way. Over the years I have noticed that trying to force a financial statement into a creative layout, or vice versa, is a recipe for disaster. Different situations require different frameworks to keep the data clean.
Let let me be straightforward about this: choosing the right format right from the start saves you a massive amount of moving things around later. Here are the most common setups I have put together for the site.
1. Business Reports
These are the absolute bread and butter of corporate paperwork. Managers, team leads, and business owners use them constantly to map out quarterly goals, operational updates, or market findings.
My over a decade of working with printable layouts tells me that a solid business document needs to get straight to the point. I design these with clean, professional sections for your main objectives, findings, and recommendations. They are built mostly in Word and Excel so you can easily drop your company logo at the top and change the color accents to match your brand.
2. Financial Reports
Every business, no matter if it’s a massive corporation or a small family-run shop, needs to keep a strict eye on its money. These layouts are designed to format your profit and loss statements, balance sheets, and cash flow updates without looking like a chaotic mess.
What I personally like about these is that they rely on structured grids. If you grab the Excel versions, they often come with built-in formulas to handle the math for you, which honestly helps cut down on those annoying manual entry mistakes.
3. Project and Progress Reports
Whether you are managing a construction site, a software sprint, or a school group project, everyone wants to know one thing: what is the actual status? These templates help you break down what milestones you’ve hit, what tasks are currently stuck, and what the team needs to focus on next.
I have built these in weekly and monthly variations. They include clean bulleted blocks and small placeholders where you can slip in a progress chart or a timeline graph if your stakeholders prefer visual updates.
4. Academic and Research Reports
Students and researchers have a completely different set of rules to follow. School assignments, theses, and lab studies require a very specific, formal hierarchy, usually running from an abstract and methodology section down to the final results and conclusions.
I keep these layouts highly structured and clean in both Word and Google Docs. A few of them are pre-formatted to align with standard style guides like APA or MLA, so you can focus on your actual research instead of fighting with double-spacing rules and citation margins.
5. Incident and Performance Reports
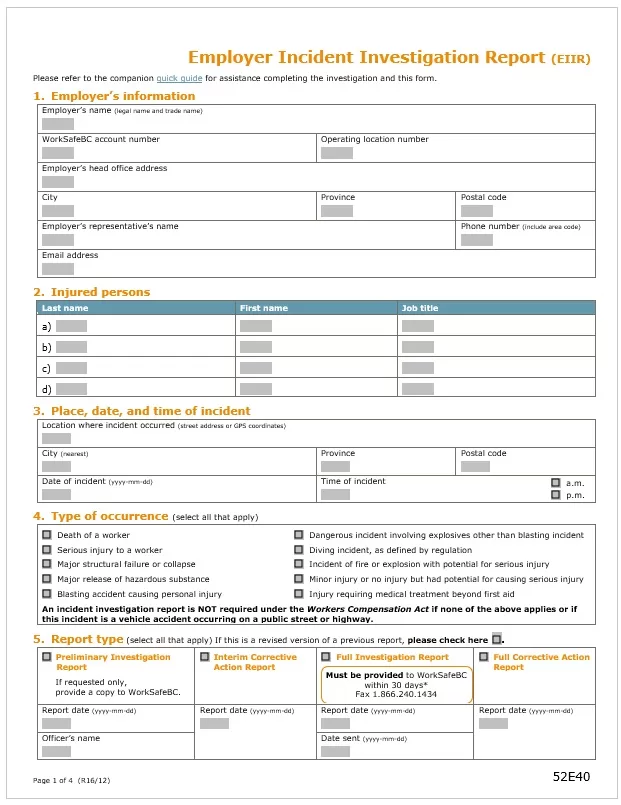
These come in handy when you need to document specific workplace events or track how your team is doing. Incident templates give HR managers or school administrators a quick, standardized way to log accidents, safety issues, or client complaints right when they happen.
Performance layouts, on the other hand, are built to review an employee’s achievements and growth areas over the year. They are simple, document style forms that keep your internal record-keeping consistent and easy to file away in a cabinet or folder.
6. Marketing and Sales Reports
In sales and marketing, nobody wants to read a giant wall of text. They want to see the numbers, the conversion rates, and the return on investment (ROI) as clearly as possible.
Because visuals are king here, these templates feature prominent spaces for graphs, charts, and tables. I usually recommend the Excel or Google Sheets versions for these, purely because it is much easier to update your monthly leads and revenue figures in a spreadsheet that calculates the totals automatically.
Go ahead and look through the collection below, grab the specific layout that matches what you are working on, and fill it in. Hopefully, this saves you some time today.
My Top Tips for Putting Together a Solid Report
At the end of the day, a template only gets you halfway there. You still need to make sure the information you drop into it is actually clear and easy to read. It doesn’t matter if you are working on a high-stakes corporate update, a quick weekly project log, or a research paper for school, a few basic principles can turn a boring document into something people genuinely understand.
Keep It Organized and Get Straight to the Point
Don’t make your reader guess what they are looking at. Use clear headings and subheadings to break up the text. I always recommend starting with a quick summary or introduction right at the top to explain the main point of the document. All your data should flow logically from there so the final conclusion actually makes sense.
Use Charts and Tables Wisely
A giant wall of numbers is hard for anyone to digest. Dropping in a clean chart or a table makes trends and comparisons pop out instantly. That said, don’t overdo it. Only use a graphic if it actually helps explain a point, you don’t want the page looking cluttered for no reason. Many of my Word and Excel layouts have built-in placeholders for charts, so you can just drop your data in and the formatting stays perfectly lined up.
Double-Check Your Numbers
This might sound obvious but it actually makes a real difference: check your math. A single typo in a financial statement or a data table can ruin your credibility with a client or manager. Keep your language straightforward, professional, and free of unnecessary fluff.
Take a Minute to Review Before Printing
I will be honest, we all make mistakes when typing fast to hit a deadline. Before you hit save or send it off to the printer, take a quick pass to look for weird line breaks, spelling errors, or messed up margins.
Combining these basic steps with one of the pre-made layouts below will help you turn out a clean, professional document in no time. Go ahead, grab the format you need, fill it in, and you’re good to go. Hopefully, this whole guide saves you some time today.
