Download these 20 Free Process Flow Chart Templates in MS PowerPoint to help you create your own PowerPoint Presentation for any kind of Process Flow Chart Diagram quickly.
In organizations and companies, there are hundreds of operations and tasks done on regular basis. It’s often seen that some of the important tasks might be overlooked or forgotten if there is no way to track the progress on these assignments. One of the ways to keep track of each process and understand basic operations is by creating a process flow chart. In this flow chart, there are diagrams and processes written from the beginning of the operation till it’s finished. Business owners and project managers use these flow charts to understand how a process should be executed, what operations it will require, how much manpower is necessary and the timeframe to complete important milestones. Not only that but this process flow chart also guides the team members in the right direction if there is a delay or obstacle and they need to adopt an alternate execution plan.
Contents
Key Elements of a Process Flow Chart Diagram:
Mainly it depends on each business and organization that what components they add in the process flow chart diagram but there are some common and basic components that can make up a very useful and effective flow chart in most of the cases. A common process flow chart mainly includes four components listed below.
- Start and end:
The start and end of a process is shown as an oval shape in the process flow chart. This means the top of the diagram includes an oval shape where start is written and at the end of the flow chart, there is again an oval symbol that indicates towards the finish or completion of the process. - Data entry:
Throughout the operations and processes, wherever there is data entry, it’s marked with parallelogram. This means whether you put the data in the operation or get output data, it must be mentioned with the same symbol. - Data processing:
As soon data is entered or taken out of the process, it is checked and verified. This is done by indicating the data processing by a rectangle. On the process flow chart, there can be multiple rectangles because the data might be processed more than once. - Decision making:
After the data is processed or evaluated, the management makes a decision to follow the same steps if they are satisfied with the results or they can change the process by going back to the data entry step and putting in different data. In either way, whenever there is a decision needs to be made, it’s indicated with a diamond shape symbol.
Free Process Flow Chart Templates:
Here are previews and download links for these Free Process Flow Chart Templates

Download link for this Flow Chart Template 01 in MS PowerPoint Format,

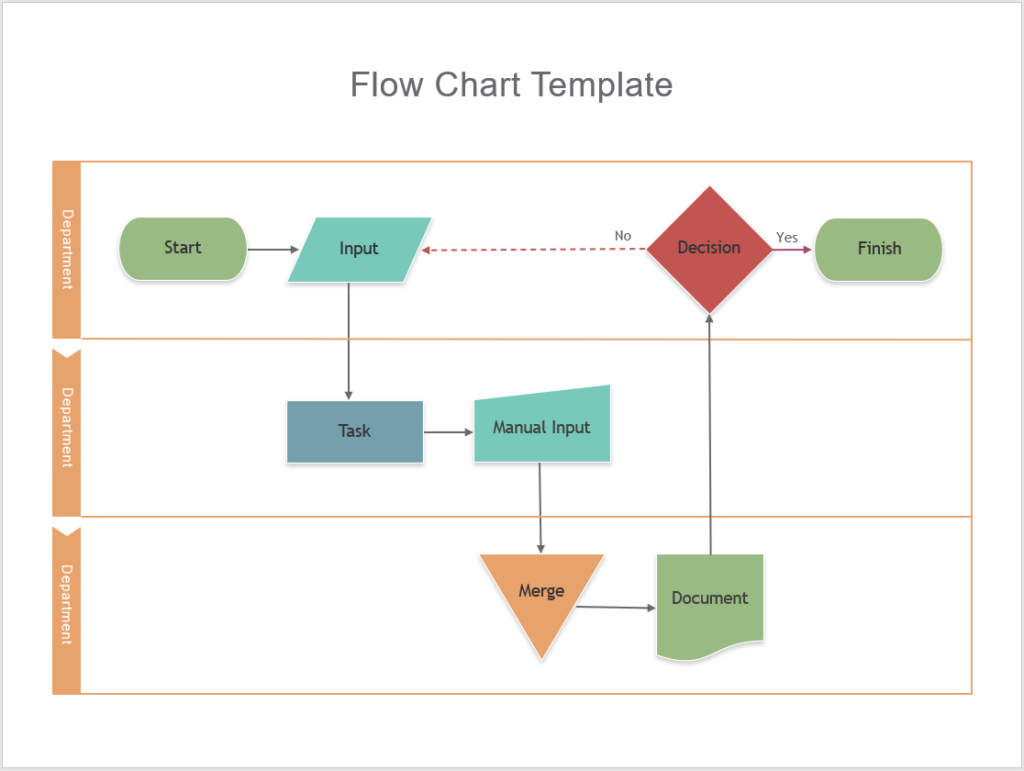
Download this Flow Chart Template 02 in MS PowerPoint format,
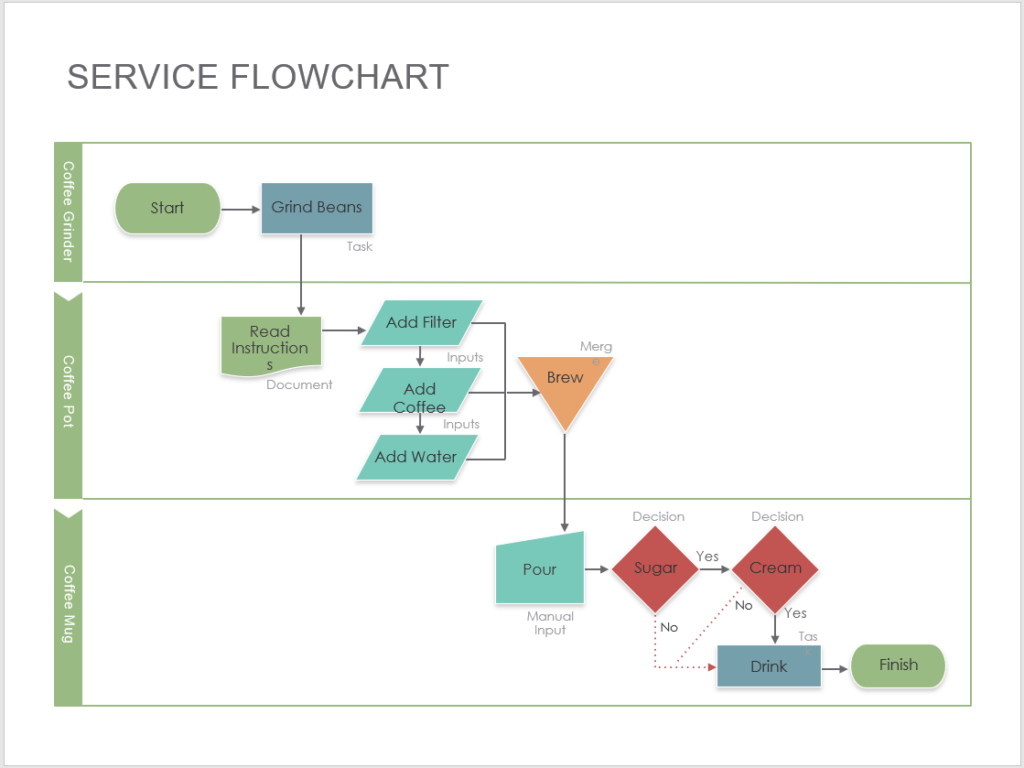
Please click on the download button bellow to start downloading this Flow Chart Template 03 in MS PowerPoint Format,
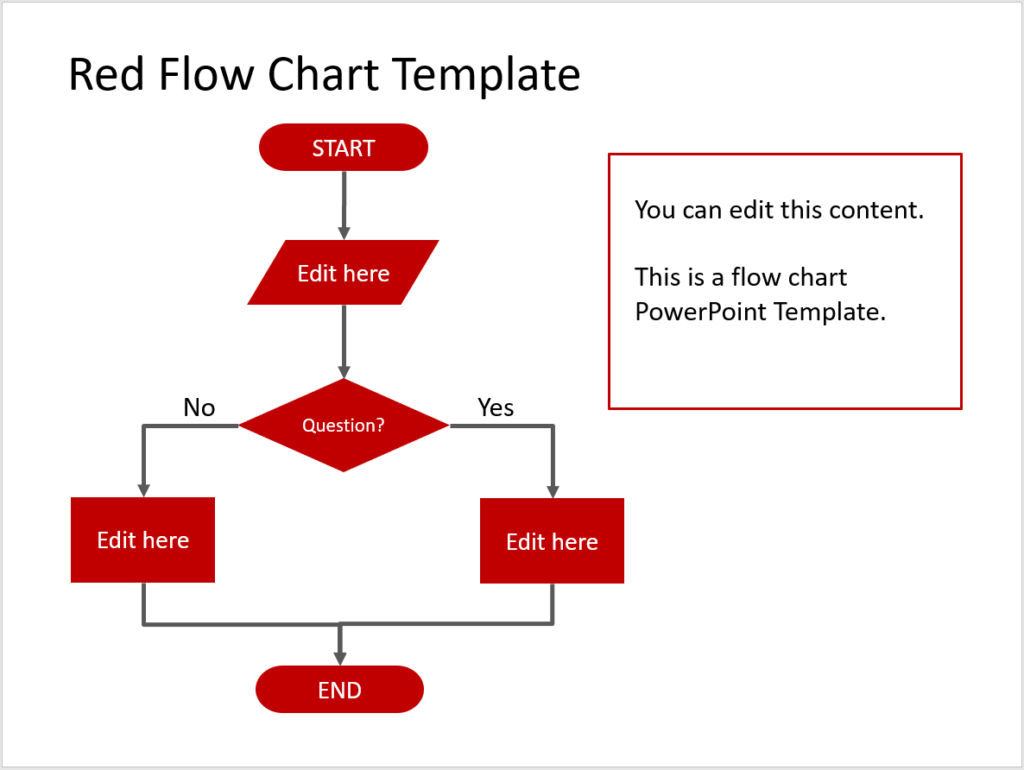
Download link for this Flow Chart Template 04 in MS PowerPoint is below,
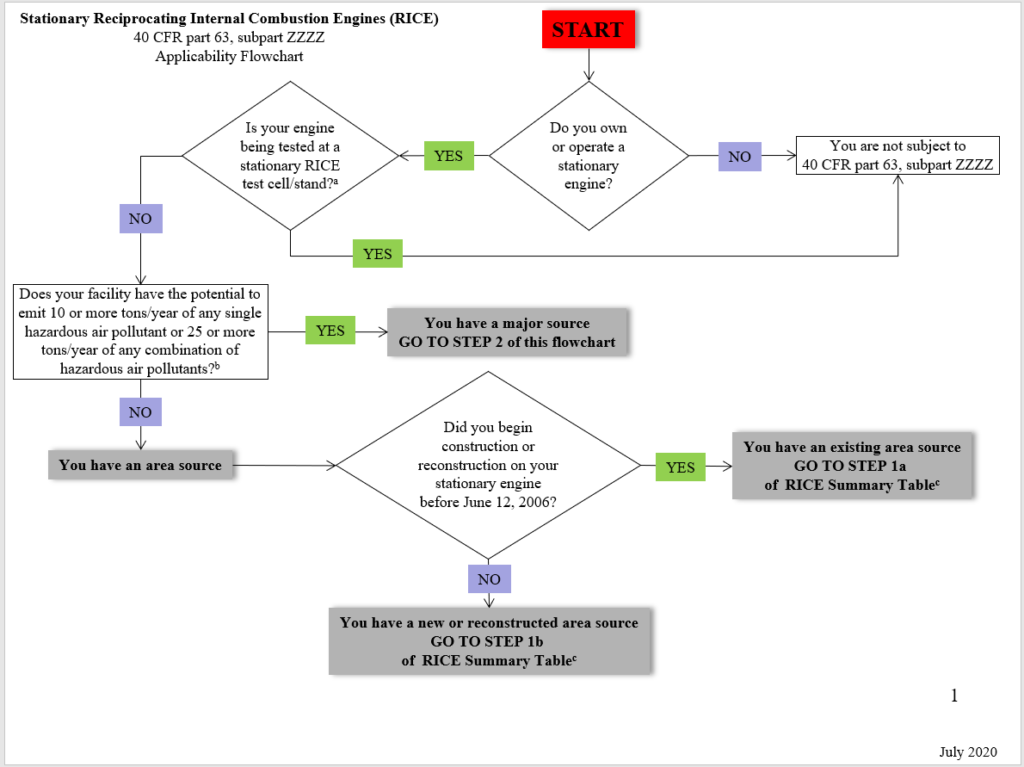
Here is download link for this Flow Chart Template 05 in MS PowerPoint Format,

Download link for this Flow Chart Template 06 in MS PowerPoint is below,
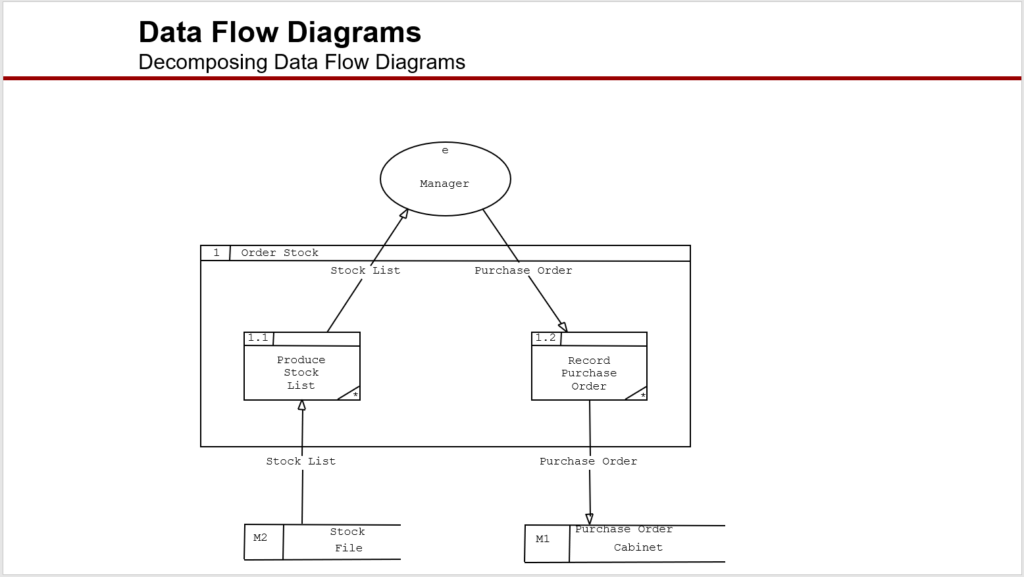
Here is download link for this Flow Chart Template 07 in MS PowerPoint format,
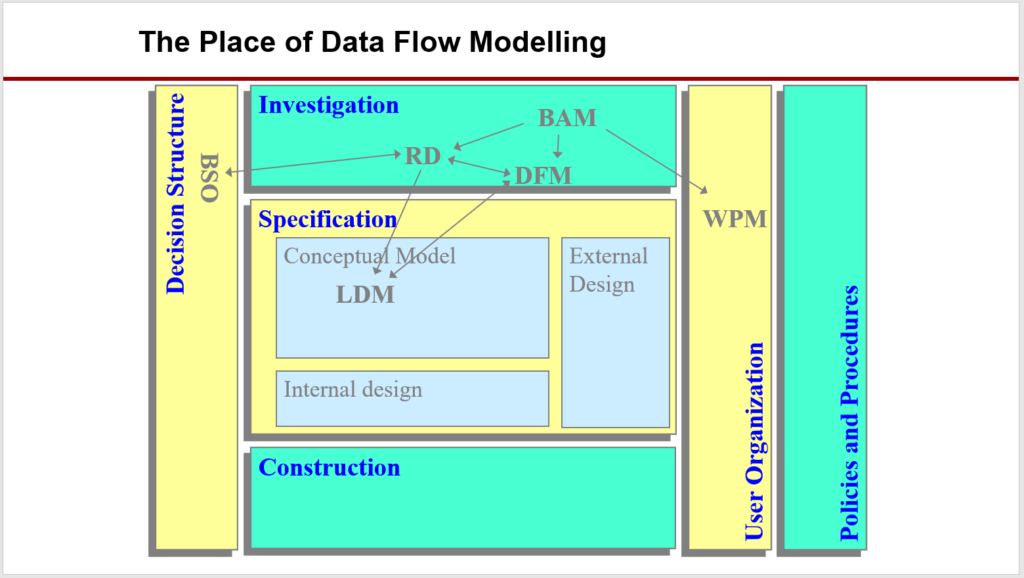
Download link for this Flow Chart Template 08 in PPT or MS PowerPoint Format,
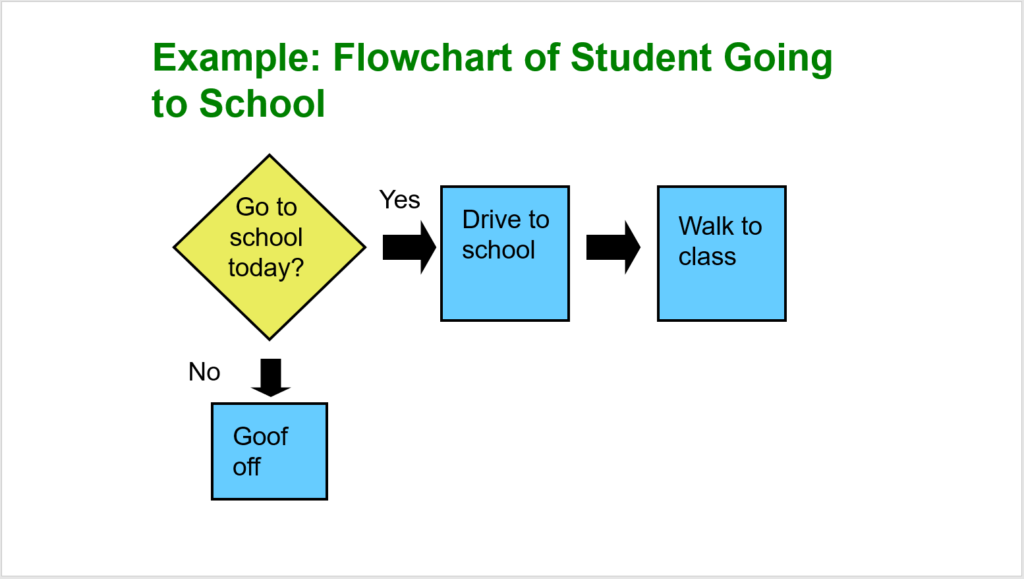
Here is download link for this Flow Chart Template 09 in MS PowerPoint,
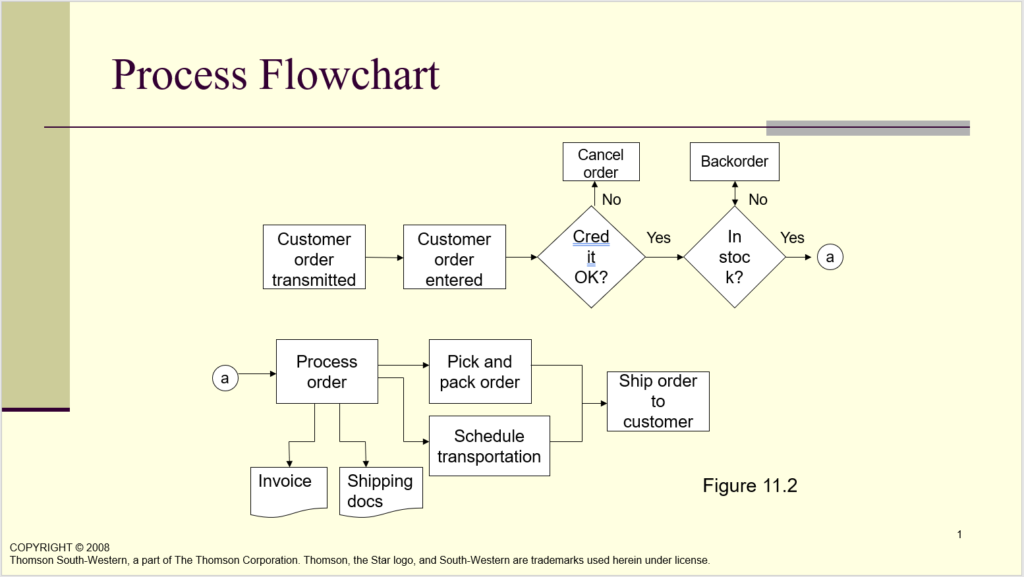
Download link for this Flow Chart Template 10 in MS PowerPoint,
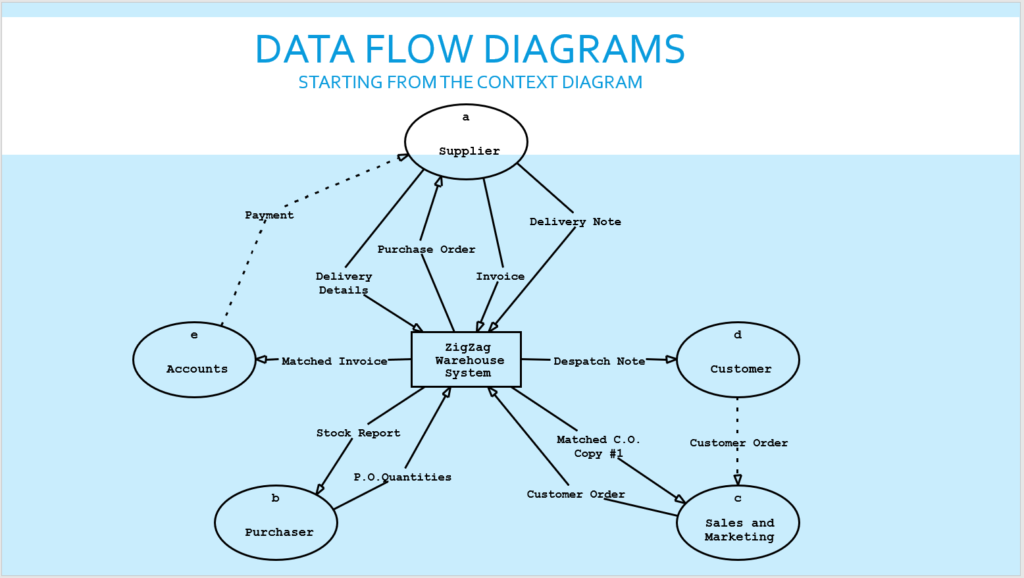
Here is download link for this Flow Chart Template 11 in MS PowerPoint Format,

Download link for this Flow Chart Template 12 in MS PowerPoint format,
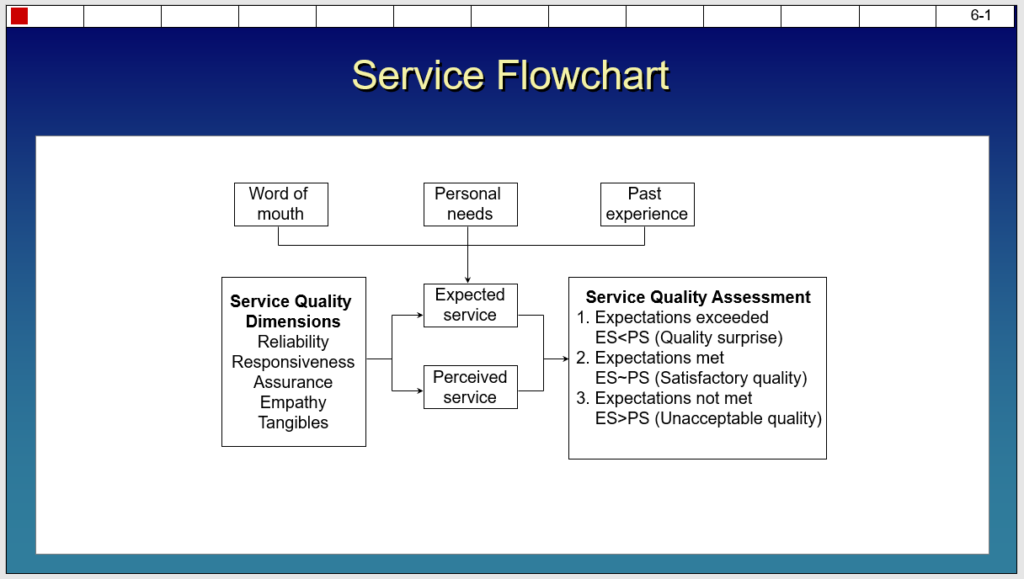
Here is download link for this Flow Chart Template 13 in MS PowerPoint format,

Download link for this Flow Chart Template 14 in MS PowerPoint Format,
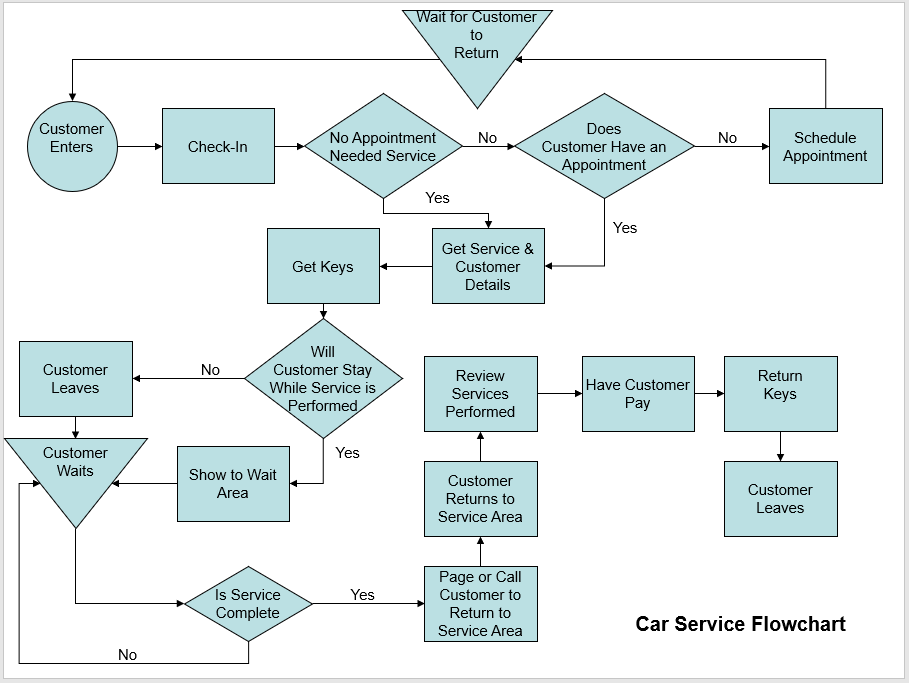
Here is download link for this Flow Chart Template 15 in MS PowerPoint Format,
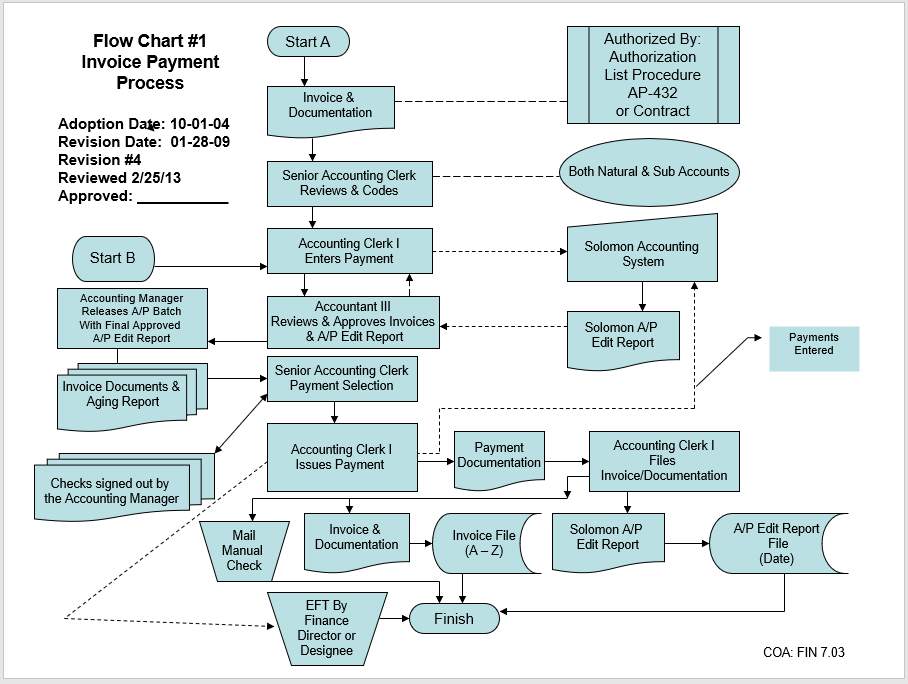
Download link for this Flow Chart Template 16 in MS PowerPoint Format,

Here is download link for this Flow Chart Template 17 in MS PowerPoint format,

Download link for this Flow Chart Template 18 is below,

Here is download link for this Flow Chart Template 19 in MS PowerPoint format,

Download link for this Flow Chart Template 20 is here,
Modern Trends of preparing Process Flow Chart:
- Using a specific shape of the chart:
There are mostly two formats of creating a process flow chart; from top to bottom or from left to right. The effectiveness of both methods is almost equal and it’s mostly personal preference. Some might like top to bottom approach while some would prefer left to right method. In either way, top or left is the point where it all starts. - Adding correct symbols:
There are more than twenty types of symbols used in the process flow chart. Each of these symbols indicates towards something different and unique. If someone fails to add the correct symbol, the flow chart is just not correct even if the description written within the symbol is still correct. - Using arrowheads to mark the flow of the chart:
Although it’s already defined that the chart moves from top to bottom or from left to right, it’s still important to use lines and arrowheads to connect two or more processes with each other and the arrowhead shows the direction of the chart. - Use as few words as possible:
As discussed above that process flow chart includes specific symbols and diagrams that each means something different, these symbols are kept empty and inside each symbol, there is a short description written. While you create the flow chart, you need to make sure to use as few words as possible and keep the explanation or description very brief.
