Download these 22+ Free PERT Chart Templates in MS Word and MS PowerPoint format to assist you in the process of creating and printing your own PERT Charts.
Companies and organizations that handle hundreds of projects on a regular basis, often deal with the problem that team members lose track of the progress of a project while working on multiple items at the same time. In the same manner, when a supervisor is handling more than one project at once, he is bound to miss a deadline or have a misunderstanding about a crucial milestone for the completion of a project. To overcome these and many other project-related issues, organizations use highly developed tools to keep track of their projects. One of these tools is commonly known as a PERT chart. PERT is an abbreviation of Program Evaluation Review Technique. This system is used around the world in various organizations but interestingly it was developed back in 1957 by USA Navy for correct guidance of nuclear submarines. Regardless of what business you run and what your core products or services are, there is a vast scope of PERT charts being used for any field area.
Contents
Uses and importance of PERT charts
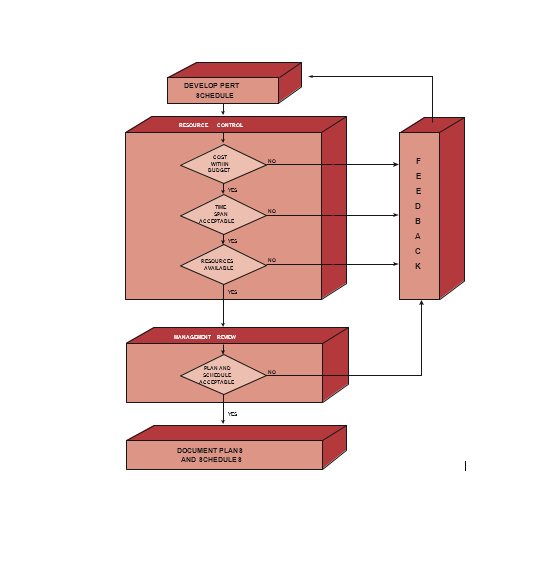
When we talk about PERT charts, there are many advantages and benefits to talk about but perhaps the most important benefit of this chart is that if it’s created at the beginning of a project, it can give a complete overview of the entire project’s timeline to the supervisor and team members. Like a 360 degree camera in a car, a PERT chart gives a bird-eye view of the full project to the team members, and with this chart, they can look at what tasks should be completed first in order to move forward and what milestones are crucial to complete if deadline can’t be extended. Another important reason for using a PERT chart is when you want to visually present the dependencies of one part of the project on other parts; there is no better technique to use than a PERT chart. Not only that this chart allow the users to quickly see if a milestone can be achieved before a specific portion of the project is finished but it will also allow the supervisors to see the possible delays and hurdles that they might encounter during the execution of the project.
Project managers understand that when executing an important project, the timeline is what matters the most after the successful completion of the project. Clients not only emphasize on completion of the project but also desire to see the end product in time because most of the time, a project is somehow connected to many other projects, and following the timeline of each of those projects is more than important. Another important benefit of the PERT chart is that it allows all the project-relevant information to be presented in the same place. There is no need to create multiple charts for each department that is involved in the execution of the project but they can also see their crucial duties and responsibilities in the same place. With this, each of the department heads can then join heads with other HODs to evaluate if the completion of the project is in fact possible in time.
Market practices of PERT charts
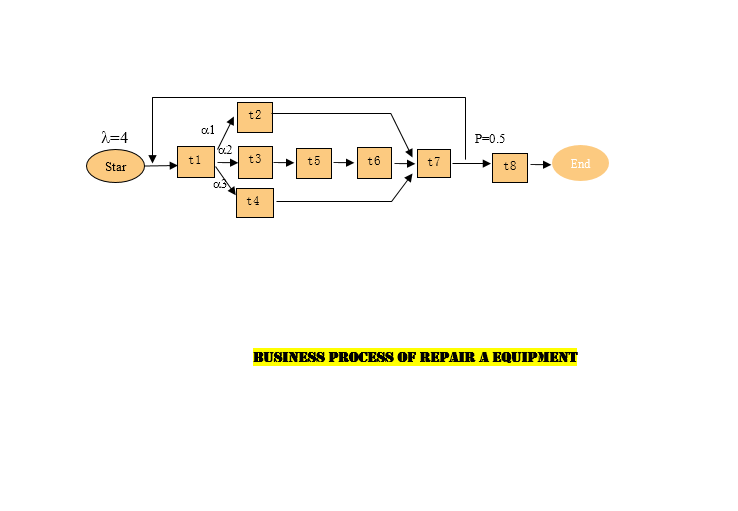
In order to create a PERT chart, you need to understand what it represents and more importantly, how information is conveyed on the chart and how to interpret the information back. There are two most important parts of a PERT chart that you need to understand including; nodes and arrows. A node can be a rectangle or a small box that represents each milestone of the project. On the other hand, an arrow represents the flow of the work which means when the arrow comes from a rectangle and points towards a box, it means in order to start working on the box, the rectangle must be completed first. Here are some of the key elements that you need to include in a PERT chart.
Download Free PERT Charts
Here are several free PERT Chart Templates to assist you in the process of creating and printing your own PERT Chart easily.


Brief Description of the Project with all Vital Details
The PERT chart is all about projects and their successful completion which means it makes sense to gather all the relevant information important to project execution and mention it on the PERT chart. This will include the name of the project itself, the supervisor or manager of the project, the names of the team members, their key responsibilities and duties in the project, and the departments involved in the execution. Then there should be a clear mention of the completion timeline of the project. This will include the date by which the project should start and the date on which the project should be completed at any cost.
All the activities or milestones involved in Project Completion:
Once basic information about the project is completed, it’s time to move to the actual activities and steps involved in the completion of the project. Before preparing the PERT chart, you should have a list of all the activities that are crucial for the project. These can be something very simple or complicated depending on the type of the project. In order to create a comprehensive PERT chart, you need to understand all the activities first.
Considering the Dependencies of each Milestone
When you have a list of all the activities that must be completed for project completion, there should be enough information for you to see which activities depend on other tasks and portions. It’s highly unlikely that each part of the project is independent which means if you want to start part B; it can’t be started before part A is completed. These dependencies of all activities should be mentioned before the PERT chart is prepared.
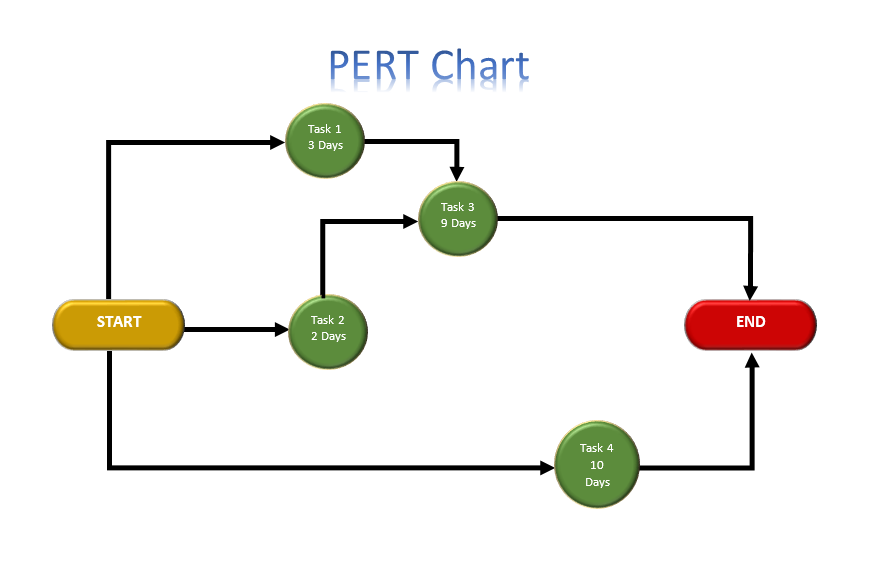
Placing Arrows and nodes for all Activities
Once you have completed the above steps, then its a piece of cake to finish off the PERT chart. You need to show a symbol i.e. rectangle or a circle for each activity on the chart and then join these boxes rectangles or circles with arrows or vectors. It depends on the individual project how many nodes it has and how they are dependent on each other but the important part here is to start mentioning the activities from the left side with the first node being the beginning of the project and then ending it to the last node at the right side which is the completion of the project. In the chart, if an arrow starts from node A and points towards node B, it means that 2nd activity can’t be started before 1st activity is finished.
Defining the timeframe for completion of each Milestone
At the end when you have finished the chart, there is only one thing to do and it is to mention the completion timeframe for each milestone and the project itself. When you mention the time that each activity will take to complete, each department involved in the execution will have a better idea of how fast they need to work so the next step of the project is not delayed.
