Download these 9 Free Sample Financial Analysis Sheet Templates to assist you. Before investing in a new company or taking a joint venture opportunity with another business. Most of the business owners first evaluate the health and financial stability of the other partner. If you were asked to invest in a company. You have the right to evaluate and examine how the company is doing. And whether it’s a safe place to invest your money or not.
For this reason, companies and organizations hire professional analysts to evaluate the financial situation of the company. They prepare the final Financial Analysis report for your review. This report shows the results about the past, present, and expected future value of the company. It also includes the annual turnover of the company, and profit and loss statements. Moreover, it also states the financial value of the company in the market and the potential risks associated with the business.
Key Guidelines for Conducting Financial Analysis
In order to evaluate the financial situation of a company, only present situation of the company is not enough. You have to take a look at the past of the company as well. For this reason, it is important to analyze the financial statements of the company that go up to 3-5 years back in the past. This is a great way of seeing how the organization did a few years ago and what kind of crisis it dealt with at that time.
While you are looking at the past financial records of the company, the important thing is to look for sudden changes unusual movements or transactions that are flagged as red. This includes any sudden changes in the revenue, profit and loss statements, and annual turnover of the company. Whether the company went through a huge loss at a point or the sales just went up through the roof during a specific period of time, you should note these changes.
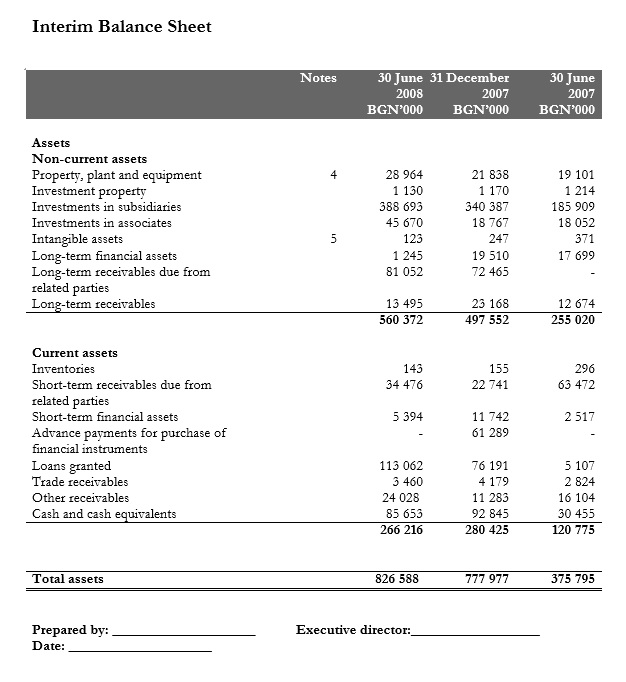
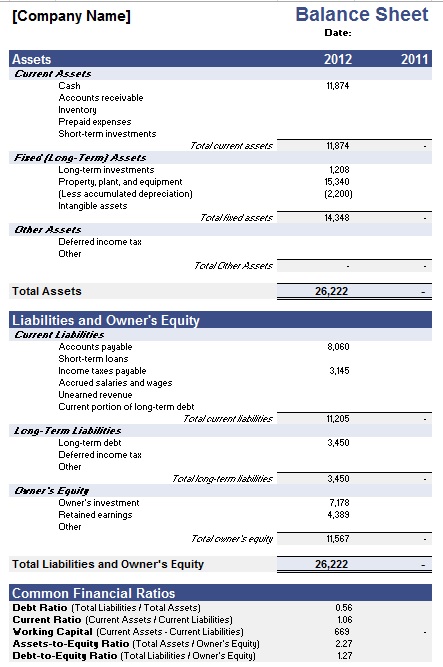
Evaluating the balance sheets of the company is also a very important part of the overall financial analysis process. Performing this will make it easier for you to evaluate the overall health and financial situation of the company i.e. liabilities, equities, and debts that the company currently holds.
Tips for Conduction Financial Analysis
Evaluating the annual and quarterly income of the company is also very important. It doesn’t matter what the company sells or offers to the clients and customers but the important thing is how much profit it is making per year and what quarter of the year has the highest income. By looking at the sales and income figures from 2-3 years in the past will help you to understand the policies and strategies that resulted in higher or lower income.
The most important part of the Financial Analysis process of a company is to evaluate the market value of the company and its shares. You can either do it by researching the market and knowing the reputation of the company and comparing it with the value and reputation of its competitors or another more efficient way is to evaluate the shares and stocks. Here you will need to know about the number of stocks and shares that the company has sold in the market and shares that it has bought back from the stock market.
Free Financial Analysis Sheet Templates


Types of Financial Analysis Sheets
Spreadsheets related to financial analysis can be stored in multiple kinds of templates. This is because each kind of template serves its own purpose with respect to financial management or financial forecasting. An appropriate choice of financial analysis sheets enables Companies, as well as human beings, to evaluate performance, risk, and decisions. Some of these analytical forms are concerned with the analysis of financial results. While the other type is more reserved for a breakdown of decision making process.
Budget vs. Actual Analysis Sheets
Financial analysis sheets provide a comparison between budgeted and real numbers. The sheets show differences in what was planned versus what actually occurred in terms of revenue, costs, and profits so that the company can understand where it is overspending or undershooting it revenue wise. Constant update of the sheet is necessary so as to have flexibility when reviewing a financial analysis and enhance its managerial effectiveness.
Rolling Forecast Sheets
These financial analysis sheets make it possible to undertake a far more flexible form of budget planning whereby interest focuses on modifying deadlines and new estimates are continuously attracted. They do not work in set boundaries like static budgets. They drift beyond a period designated for budgeting reasons and imply that some room has been left to adjust one’s financial expectations regarding the present state of affairs. This sheet is especially necessary for cash flow management, letting every company prepare in advance for any problems and be able to change their policies if there is any need.
Break-Even Analysis Sheets
Financial analysis is used to determine the level of output or activity at which the total revenues for a product line equals the total costs of supplying that product line and no profit and no loss are incurred. This is most useful for young companies or those focusing on new market intelligence or product development – financial analysis sheets where such determinants are available come in quite handy. Financial probity like this, relying on the approach of variances, firms come to plan out with unifying quantities, characterized by a minimum level of output, where costs will be covered from EBIT and it can show profits afterwards.
What-If Scenario Analysis Sheets
One of the cloud-based tools for financial analysis is what-if scenario analysis. Such tools help businesses in modeling and answering their what-if scenarios regarding profitability, changes in capacity, product cost, and the likes. Overhead expenses, fixed costs, what-if elasticity. Financial analysis sheets are specifically designed and used for testing situations such as economic pressure, or regulation shifts and performance within the market, among others.
Each type of financial analysis sheet plays a crucial role in decision-making, helping businesses gain deeper insights into their financial health and develop strategies for sustainable growth.


Best Practices for Using Financial Analysis Sheets
One of the most important tools used in business assessments, strategic planning and sustaining financially sound decisions are financial analysis sheets. As a best practice with regards to financial analysis sheets, an organization should take into consideration factors that will aid in improving their accuracy, and usability and facilitate decision making processes. Well-formatted financial reports help the users to under-stand the dynamics of revenue, cost control and forecasting in a better manner.
Regularly Updating Data to Reflect Current Financial Standings
The market objectives are changing and so do Financial analysis perceptions, thus financial performance variables need to be updated from time to time. Operating with an outdated Financial analysis sheets can mislead and cause people to make wrong judgments. It can consequently affect the operations of a business. For women with Income sustenance programs, they are able to visualize themselves running businesses that are already self-sustaining. Data imports from various accounting packages can be automated and this way helps in reduction of the manual workload and adjustment of the productivity to the levels expected.
Ensuring Data Accuracy Through Cross-Verification
Financial analysis conducts within business organizations to avoid expensive errors and assist in prediction can be accurate as precision is commonly ensured through relevant cautions in the capture of data. Financial analysis on the other builds on the limitations of the previous processes of inserting data into financial analysis sheets and reviewing and correcting the errors. A further procedure is adopted when validating finance information utilizing many individuals within a team. The use of a single heading and subheadings structure as well as data classification has been adversely affected by cases of physically typing the data which has led to differences in the key entry marks.
Customizing Sheets to Align with Specific Business Needs
Due to differences in the levels of businesses concerning finances, one cannot follow a buy one get one free approach in their financial analysis endeavors, especially where financial analysis sheets are concerned. This is because how sheets are decomposed to suit organizational goals so as to zero in on accurate analysis. An example would be a new company in the market whose interest would most likely fall to break even as opposed to an old company that would concentrate on looking at profitability and cash flow plans. As this helps in adding various enhanced key performance indicators (KPIs) which are most relevant according to the industry’s demands – adding such KPIs help make sure that the financial sheets they create gather suitable information.
Maintaining Organized Records for Audit Trails
Creating financial analysis sheets or corresponding storage formats should be easy to keep track of and retrieve for historical data. Some examples of when a business would need to have organized financial analysis is while preparing for an audit, for investors, or other regulatory reports. Organizing files in chronological order, by department, or project, makes it easier to find vital financials without spending a couple of minutes or hours digging. Cloud-based storage and financial infrastructure tools facilitate records in history by giving access to relevant financial data, safely away.
A financial analysis approach structured along these best practices enables firms to gain better utility from financial analysis sheets as every financial decision will be based on credible, optimal and usable data. As a result, such practices allow firms to operate more effectively and efficiently in an anticipating manner as well as to sustain their inner financial stability in the dynamic marketplace.
